
New Delhi: While the United States remains a critical market for Indian goods, the country’s export profile is broadening at a pace not seen in recent years. This shift follows the structural pressure of heightened (and unreasonable) US tariffs and the push for resilience in global supply chains.
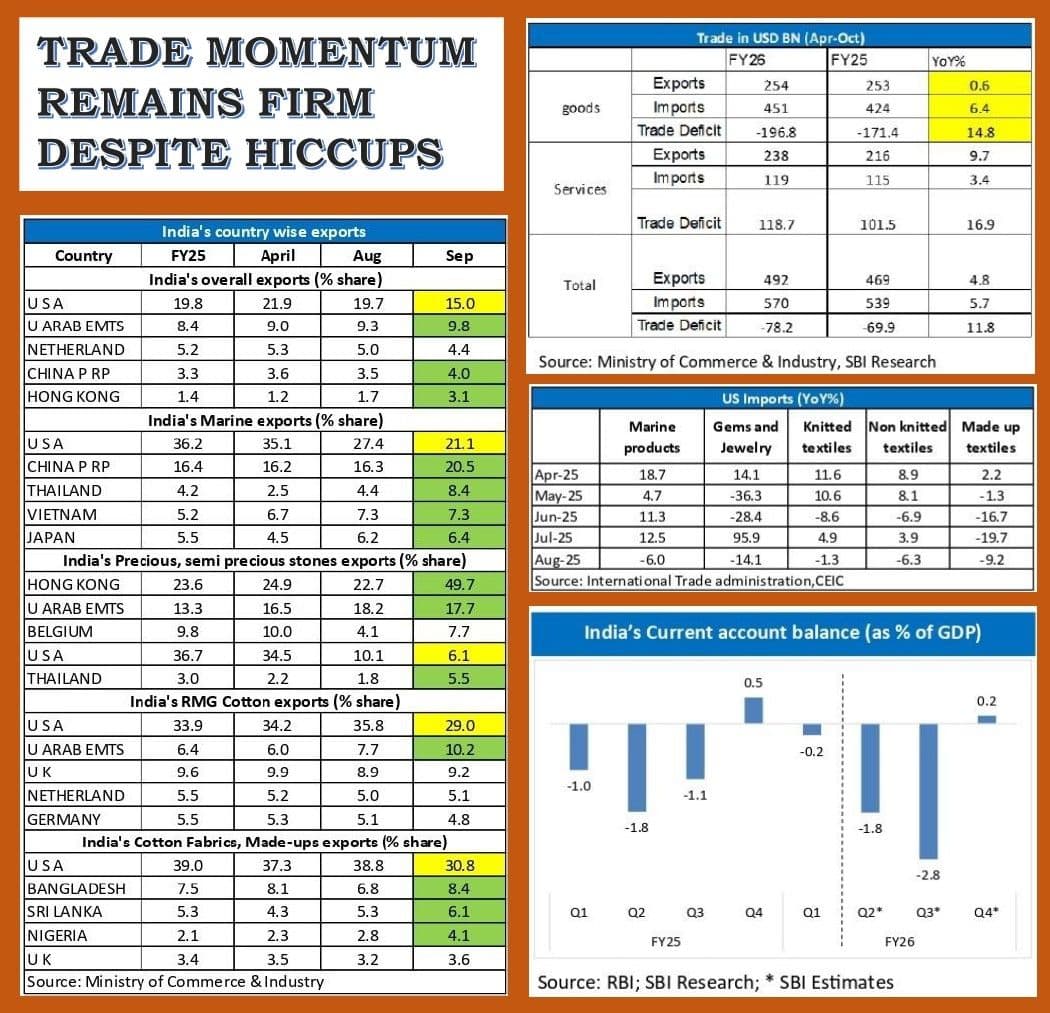
India’s total merchandise exports during April-September FY26 rose 2.9% to $220 billion, up from $214 billion during the first half of FY25, according to the recent SBI Ecowrap analysis. The increase is modest, but the directional change is significant. Shipments to the US grew 13% during the period to $45 billion, though the momentum is fading. September exports to the US contracted nearly 12% year-on-year, and the US share in India’s overall exports has been declining since July 2025, settling at 15% in September.
A closer dissection shows this deceleration is most pronounced in labour-intensive categories that have traditionally been US-oriented. The share of the US in India’s exports of marine products dropped to 15% in September from 20% in FY25. Similarly, the share fell sharply for precious and semi-precious stones (to 6% from 37%), readymade garments of cotton (to 29% from 34%), and cotton fabrics and made-ups (to 31% from 39%).
Interestingly, even though marine products and RMG cotton saw annual growth in absolute export value during April-September, their geographical orientation has widened.
The SBI Ecowrap says, the diversification towards countries such as the UAE, China, Vietnam, Japan, Hong Kong, Bangladesh, Sri Lanka and Nigeria is emerging as a defining feature of FY26. These destinations have gained prominence across multiple product categories, suggesting a strategic re-routing of trade rather than a fall in demand.
Indirect Channels Gain Ground
The trade narrative now raises an intriguing question: While India exports less proportionately to the US, are other countries re-exporting Indian goods to the American market?
Recent trade statistics reinforce this possibility. Australia’s share in US imports of pearls and precious or semi-precious stones surged to 9% in January-August 2025 from 2% a year ago, while Hong Kong’s share doubled from 1% to 2%. During the same period, US imports of these commodities from India showed declining growth, hinting that the reshuffling may involve supply chain intermediaries taking the place of direct exporters.
This shifting matrix indicates both an emerging trade workaround and the rapid evolution of supply networks. It may also be a harbinger of deeper consequences if tariff barriers stay elevated for longer.
Tariff Overhang and the India-US Trade Deal
India currently faces the highest US tariff burden among its Asian peers, a lingering legacy of the “punitive” 25% duty imposed on countries purchasing Russian oil. With Russian crude inflows to India tapering since October 21, New Delhi expects that Washington may roll back the tariff, eventually normalising to around 15%. India is willing to reciprocate by reducing duties on over 80% of imported goods but is keen to shield agriculture and other sensitive sectors.
The tariff impact is visible in global container flows. Among the 10 largest suppliers to the US, cumulative container arrivals fell 9.4% in October 2025 versus October 2024. Shipments from India registered the sharpest decline at 18.4%, followed by China at 16.3%. In contrast, Indonesia, Thailand and Vietnam — with lower tariff exposure and greater cost competitiveness — recorded positive growth between 3.6% and 10.1%.
The fallout has been the most severe in India’s labour-intensive export clusters: textiles, jewellery and seafood. Shrimp exporters have been particularly squeezed as thin margins amplify tariff-linked distress.
To cushion exporters and sustain diversification efforts, the Centre has approved a ₹45,060-crore support package, including ₹20,000 crore in credit guarantees for bank loans. The scheme is expected to boost liquidity, provide collateral-free access under the CGTMSE framework and ensure business continuity amid elevated freight costs and tariff-induced shipment volatility. The SBI Ecowrap notes that this intervention is aimed at preventing capacity attrition while preparing exporters to penetrate new geographies.
Rupee Whipsaws on Global Turbulence
The currency market has reflected the external tremors as well. The rupee experienced a sharp slide in the latest trading cycle, hitting ₹89.61 per dollar, its weakest level this financial year and nearly 1.7% lower than the previous close. The fall was accompanied by a momentary surge in volatility, with intra-month fluctuations widening to levels not seen earlier this year.
Multiple global triggers converged: a selloff in US tech giants amid questions surrounding ultra-premium AI valuations, a synchronised tumble in digital assets, and rising pressure on Japan’s financial system. The US Dollar Index (DXY) crossed 100, strengthening the greenback across the board. Meanwhile, the Reserve Bank of India reiterated it has no intention of defending any particular exchange rate, particularly given the rupee’s elevated REER/NEER readings.
While the sudden drop was unsettling for markets, analysts believe it does not reflect structural weakness. Offshore NDF market positioning amplified the downswing, but India’s macro fundamentals — particularly remittance inflows and services exports — remain intact.
BoP Risks Appear Contained
India’s trade pulse in FY26 reflects a dichotomy. Merchandise exports grew just 0.6% in April-October 2025, while merchandise imports rose 6.4%. The merchandise trade deficit widened to $196.8 billion compared with $171.4 billion a year earlier. The digital and business services boom proved a counterbalance, helping services exports expand 9.7% in April-September.
On the external account, the first quarter of FY26 recorded a current account deficit of 0.2% of GDP, improving significantly from 0.9% in the same period last year. Robust services exports and private remittances, amounting to $35.3 billion in Q1 FY26, provided insulation. India continues to be the world’s largest recipient of remittances.
Based on evolving trends, the SBI Ecowrap says that current account deficit is expected to widen to around 1.8%-2.8% GDP in Q2 and Q3 before turning positive in Q4. For the full year, the deficit is projected between 1.0% and 1.3% of GDP. The overall balance of payments is likely to record a marginal deficit of up to $10 billion in FY26 compared with $5 billion in FY25.
The report emphasises that while the BoP will tip into negative territory this year, the alarm around rupee stability appears overstated. A modest expansion in India’s combined trade balance — encompassing goods and services — during April-October underscores the economy’s resilience despite the tariff shock. India’s pivot towards multi-market export strategy may ultimately reduce volatility associated with over-dependence on the US market, concluded the SBI Ecowrap.
New Phase of Trade Strategy
The coming months will test whether India’s diversification momentum sustains even if US tariff headwinds ease. For now, the export ecosystem is clearly recalibrating. Large conglomerates and MSMEs, especially those in textiles, gems and jewellery and processed seafood, are both compelled and incentivised to cultivate new markets.
If the shift continues, India could gradually move away from a US-centric export identity to a multi-hub network where Southeast Asia, West Asia and Africa play more prominent roles. The ongoing trade negotiations with Washington will matter, but so will the capacity building of domestic exporters to compete on scale, branding, logistics and supply resilience.
The next stage of India’s trade playbook, it seems, will be written not just in boardrooms and policy papers but also in how exporters respond to an uncertain yet opportunity-laden global marketplace.