

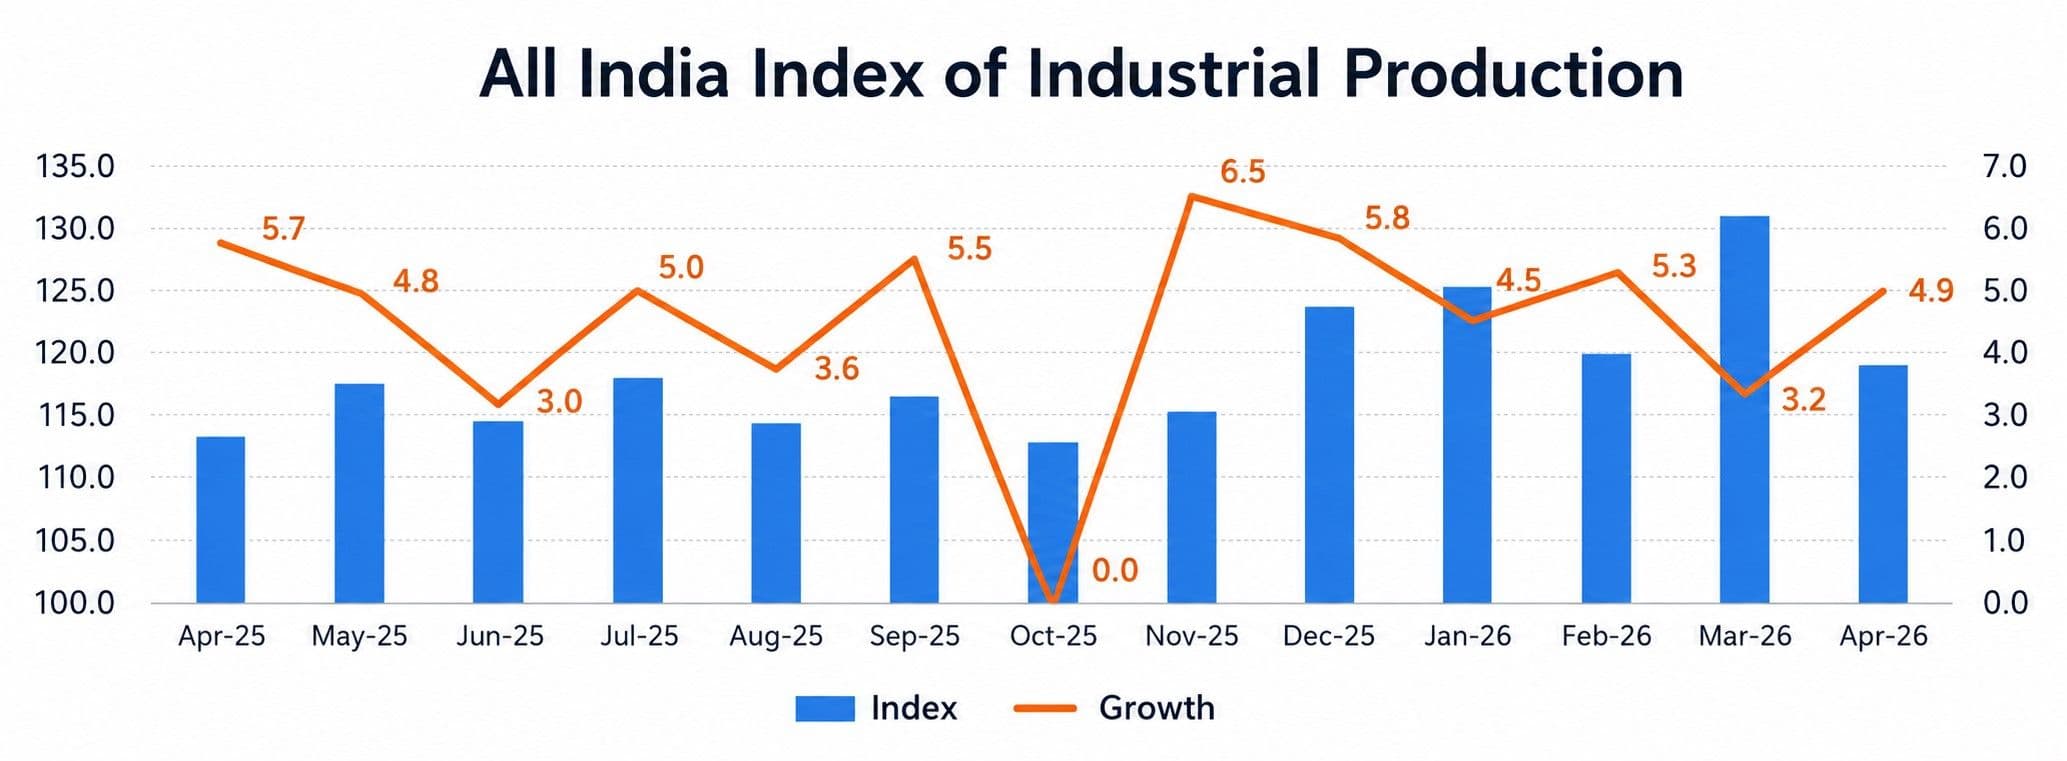
New Delhi: India’s industrial production expanded 4.9% year-on-year in April, marking the first official reading under the revised Index of Industrial Production (IIP) series with 2022-23 as the new base year.
The data, released by the National Statistical Office (NSO) on Monday (June 1), offers the first glimpse of industrial activity through a significantly revamped data framework designed to better capture the changing contours of India’s economy.
The quick estimate of the IIP stood at 118.9 in April, up from 113.1 in the corresponding month last year. The release also marks a milestone in India’s statistical evolution, with the base year shifting from 2011-12 to 2022-23, the 10th revision since the IIP was first compiled with 1937 as the base year. Subsequent revisions were carried out in 1946, 1951, 1956, 1960, 1970, 1980-81, 1993-94, 2004-05 and 2011-12.
Manufacturing, which carries the largest weight in the index, emerged as the principal growth driver. The manufacturing index rose 6.2% year-on-year to 119.3 in April 2026 from 112.3 a year earlier. According to the Ministry of Statistics and Programme Implementation (MoSPI), 17 of the 23 manufacturing industry groups recorded positive growth during the month. The strongest contributions came from motor vehicles, trailers and semi-trailers, electrical equipment, and machinery and equipment.
April’s figures suggest stronger industrial activity than in March 2026, when industrial output under the earlier series recorded a growth rate of 3.2%. However, growth remained below the comparable 5.7% recorded in April 2025.
Among the major sectors, mining and quarrying was the lone area of weakness. The index contracted to 104.6 from 110.2 in April 2025, translating into a 5.1% decline. In contrast, electricity generation and gas supply registered 4.9% growth, with the combined index rising to 125.5 from 119.6 a year earlier. The newly introduced water supply, sewerage and waste management segment posted a 6.6% increase, with its index climbing to 146.1 from 137.1.
The use-based classification painted a broadly positive picture of industrial demand. Capital goods output, a key proxy for investment activity, surged 16% year-on-year, highlighting strong capacity expansion trends. Intermediate goods production increased 7.7%, while infrastructure and construction goods rose 7.1%. Consumer durables expanded 4.3%, consumer non-durables grew 2.8%, and primary goods output registered a modest 0.8% increase.
The revised IIP series introduces some of the most significant methodological changes in more than a decade. Coverage has been expanded beyond the traditional mining, manufacturing and electricity sectors to include gas supply, water supply, sewerage and waste management activities. The mining and quarrying segment has also been broadened to incorporate minor minerals and rare earth minerals, while dedicated indices have been created for fuel minerals, metallic minerals and non-metallic minerals.
A notable feature of the new framework is the separate tracking of renewable and non-renewable electricity generation, providing policymakers with a more granular view of India’s evolving energy transition and power mix.
The revised series substantially enlarges the industrial basket. It now covers 463 item groups and 1,042 mapped products, compared with 407 item groups under the previous series. The update introduces 120 new products reflecting emerging industrial realities, including CCTV cameras, stents, aircraft and spacecraft parts, magnetic stripe cards, articles of non-woven textiles and vaccines.
At the same time, 64 products considered outdated or no longer widely produced have been removed from the basket. These include kerosene, compact fluorescent lamp (CFL) bulbs, printing machines, sewing machines and certain tyre tubes.
While the scope of industrial coverage has widened significantly, the six use-based categories remain unchanged from the 2011-12 series. These continue to comprise primary goods, capital goods, intermediate goods, infrastructure and construction goods, consumer durables, and consumer non-durables.
The ministry has also sought to improve the representativeness of the index by excluding permanently closed factories while incorporating operating units and newly commissioned large manufacturing facilities. Weighting patterns have been recalibrated using Gross Value Added (GVA) and output data from 2022-23, while dissemination now follows the latest National Industrial Classification (NIC) 2025 framework.
To ensure continuity and comparability, MoSPI will release sectoral linking factors that allow users to bridge data between the old and new series.
Economists are of the opinion that the rebasing exercise will provide a more accurate reflection of contemporary industrial activity by capturing structural shifts in manufacturing, the emergence of new technologies, changing consumption patterns and the growing role of infrastructure-linked services in the economy.
The next set of industrial production data, covering May 2026, is scheduled to be released on June 29, offering the first opportunity to assess momentum under the new statistical framework.